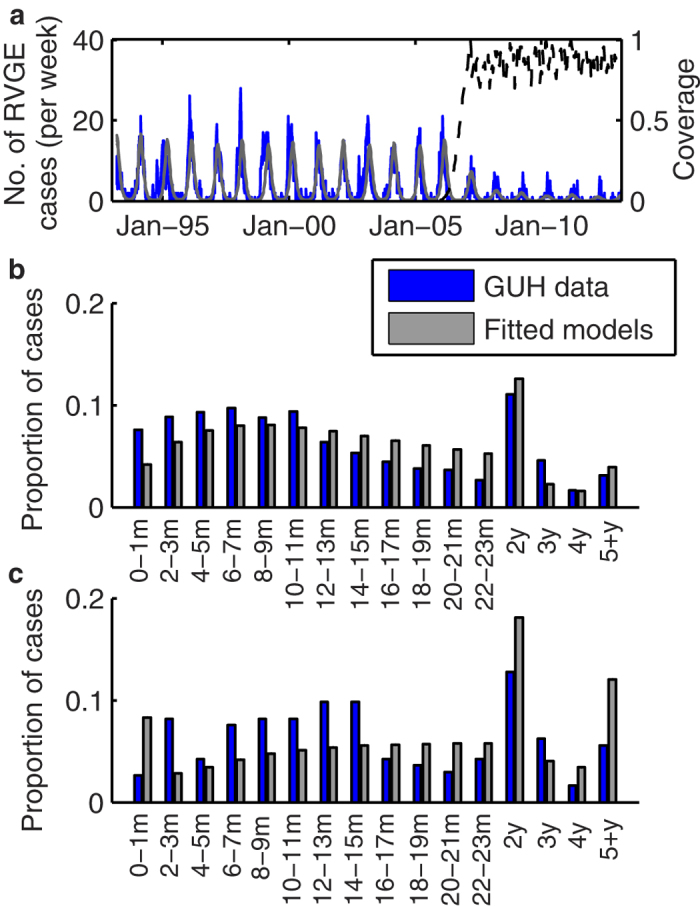
Figure 3. Validation of non-strain-specific model against hospitalization data from Gasthuisberg University Hospital (GUH) in Leuven, Belgium.

(a) The number of weekly RVGE hospitalizations at GUH is plotted in blue, while the models fit to the Carenet-NCSF data then scaled by estimating the reporting fraction are plotted in grey. The black dashed line represents the vaccination coverage in Belgium. (b) The age distribution of RVGE patients at GUH (blue) and the mean age distribution predicted by the models (grey) prior to vaccine introduction (March 1999-June 2006). The black error bars represent the range of the fitted models. (c) The age distribution of RVGE patients at GUH (blue) and predicted by the fitted models (grey) following vaccine introduction (July 2006-June 2013).
