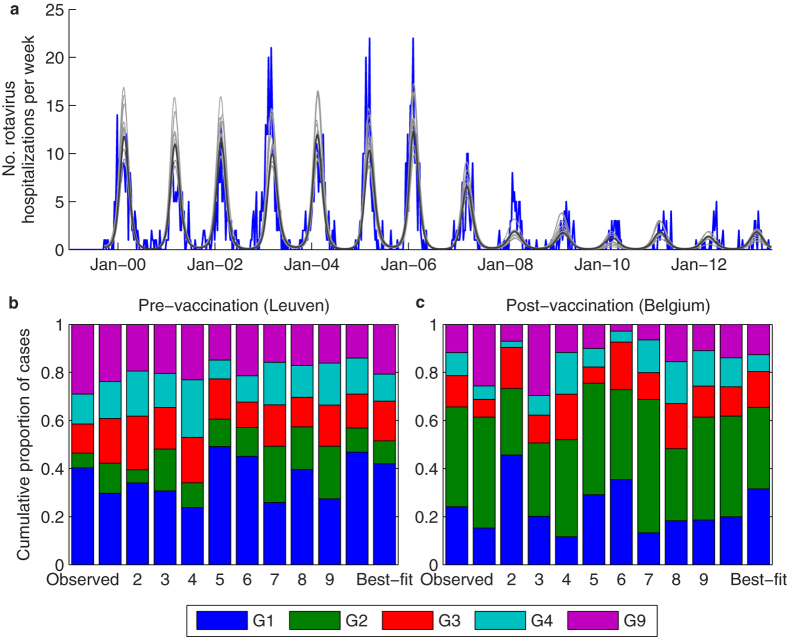
Figure 6. Model-predicted impact of vaccination on the incidence and genotype distribution of rotavirus in Belgium.
(a) Number of typed rotavirus hospitalizations at GUH in Leuven (blue) and model-predicted number of rotavirus hospitalizations for 10 randomly sampled parameter sets from the posterior distribution (light grey) and the best-fit parameter set (dark grey). (b) Observed genotype distribution at GUH in Leuven from September 1999 to June 2006 and model-predicted pre-vaccination genotype distribution for 10 randomly sampled parameter sets and the best-fit model. (c) Observed genotype distribution from the Rotavirus Surveillance Network Belgium from September 2007 to December 2012 and model-predicted post-vaccination genotype distribution for 10 randomly selected parameter sets and the best-fit model.

