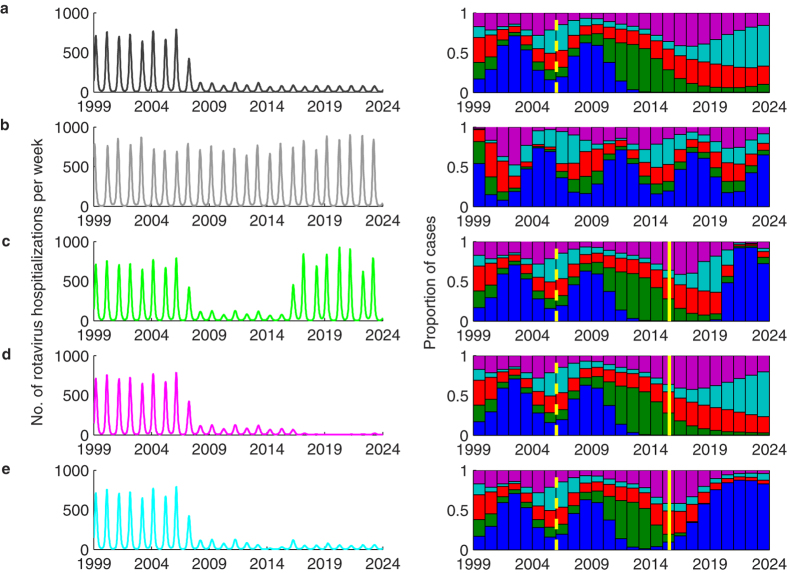
Figure 7. Model-predicted patterns of rotavirus incidence and annual genotype distributions.
Predicted number of rotavirus hospitalizations per week in Belgium from January 1999 to December 2023 (left) and annual genotype distributions predicted by the model (right) are shown for the following scenarios: (a) best-fit model predictions given the current level of vaccine coverage; (b) the predicted incidence in the absence of vaccination; (c) vaccination at current levels, then no vaccination beginning in July 2015; (d) vaccination at current levels, then increasing to 100% coverage with two doses beginning in July 2015; (e) vaccination at current levels, but with 90% of vaccinated infants receiving RotaTeq and 10% receiving Rotarix beginning in July 2015. The dashed yellow lines in the plots of the annual genotype distribution represent the year of vaccine introduction, while the solid yellow lines represents July 2015. The colours correspond to the G-types as in previous figures (blue: G1, green: G2, red: G3; light blue: G4; purple: G9).

