. 2015 Dec 21;5:18590. doi: 10.1038/srep18590
Copyright © 2015, Macmillan Publishers Limited
This work is licensed under a Creative Commons Attribution 4.0 International License. The images or other third party material in this article are included in the article’s Creative Commons license, unless indicated otherwise in the credit line; if the material is not included under the Creative Commons license, users will need to obtain permission from the license holder to reproduce the material. To view a copy of this license, visit http://creativecommons.org/licenses/by/4.0/
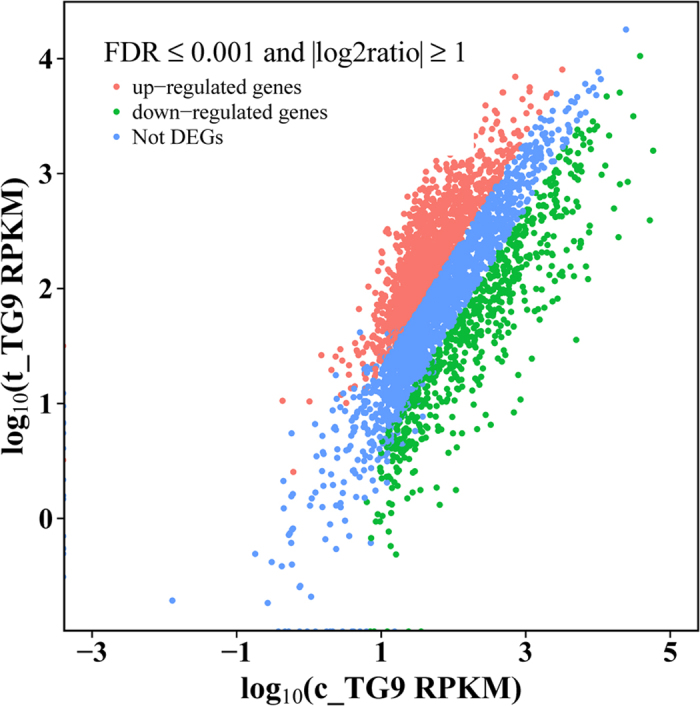
Figure 3. Differential expression level of t_TG9 versus c_TG9 using FDR ≤ 0.001 and |log2 ratio| ≥ 1.

