
FIGURE 1.
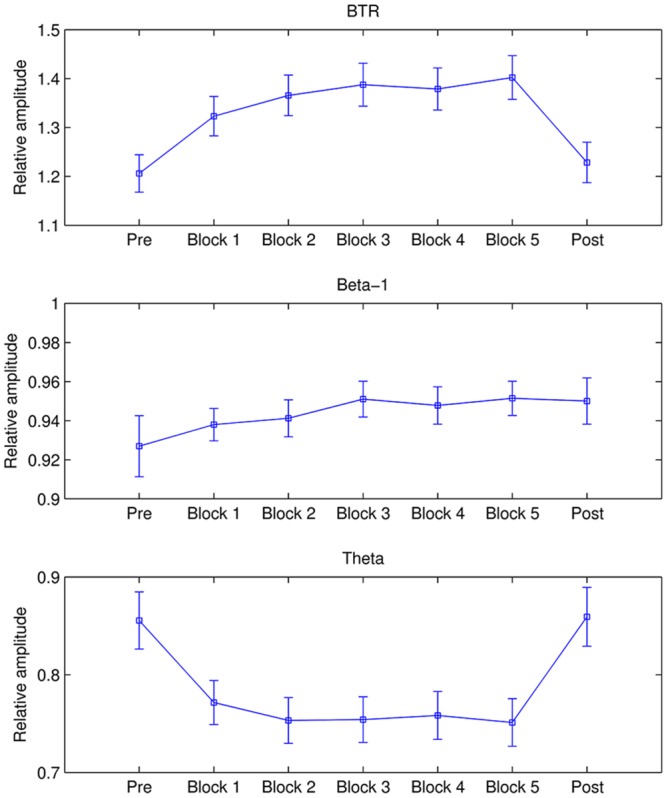
Mean BTR, beta-1, and theta in each period. The error bars depict standard error of the mean (SEM).
Official websites use .gov
A
.gov website belongs to an official
government organization in the United States.
Secure .gov websites use HTTPS
A lock (
) or https:// means you've safely
connected to the .gov website. Share sensitive
information only on official, secure websites.
Mean BTR, beta-1, and theta in each period. The error bars depict standard error of the mean (SEM).