
FIGURE 4.
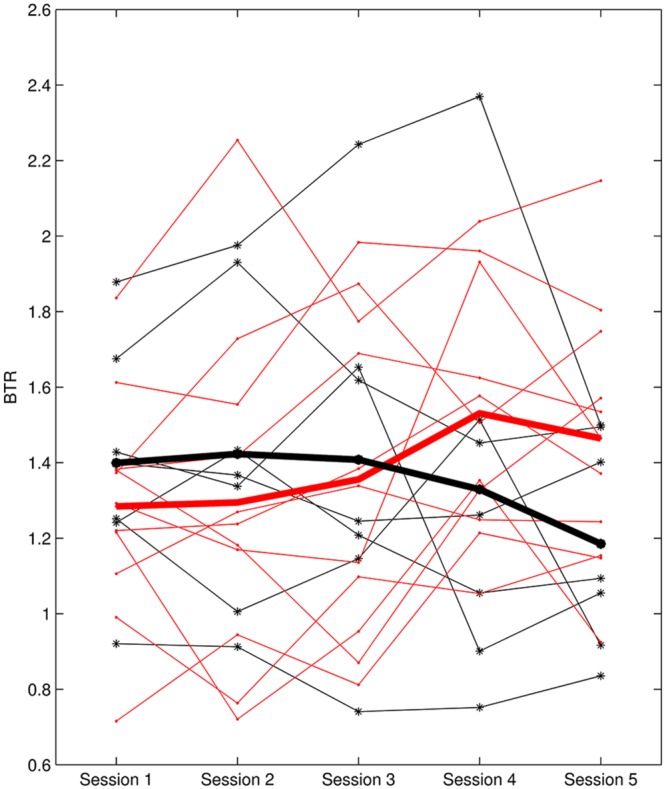
BTR across sessions of learner_L2 and non-learner_L2. Thin red lines with dot represent BTR of each learner; thick red line depicts the mean BTR across all learners; thin black lines with star show each non-learner; thick black line shows the mean across non-learners.