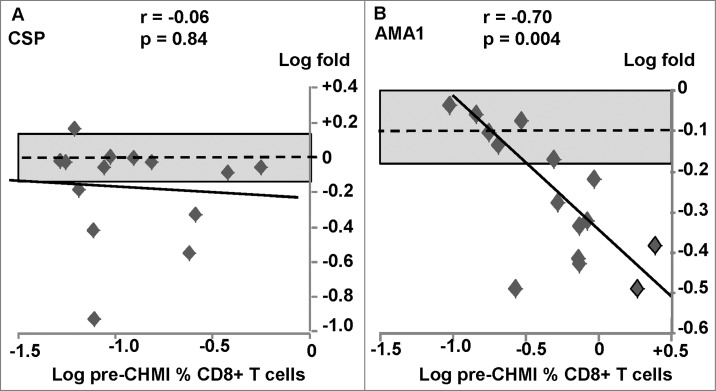
Figure 5.
AdCA trial: CD8+ T cell IFN-γ activities to CSP and AMA1. The associations of fold-changes of pre-CHMI and post-CHMI activities with pre-CHMI activities are shown as log-transformed values, and the dotted line represents no-change. The shaded box shows ±1.5 range. (A) CSP: there was no significant relationship between fold-change and pre-CHMI activities, although activities fell in 5/15 subjects. (B) AMA1: There was a significant relationship between fold-change and pre-CHMI and activities fell in 9/15 subjects.

