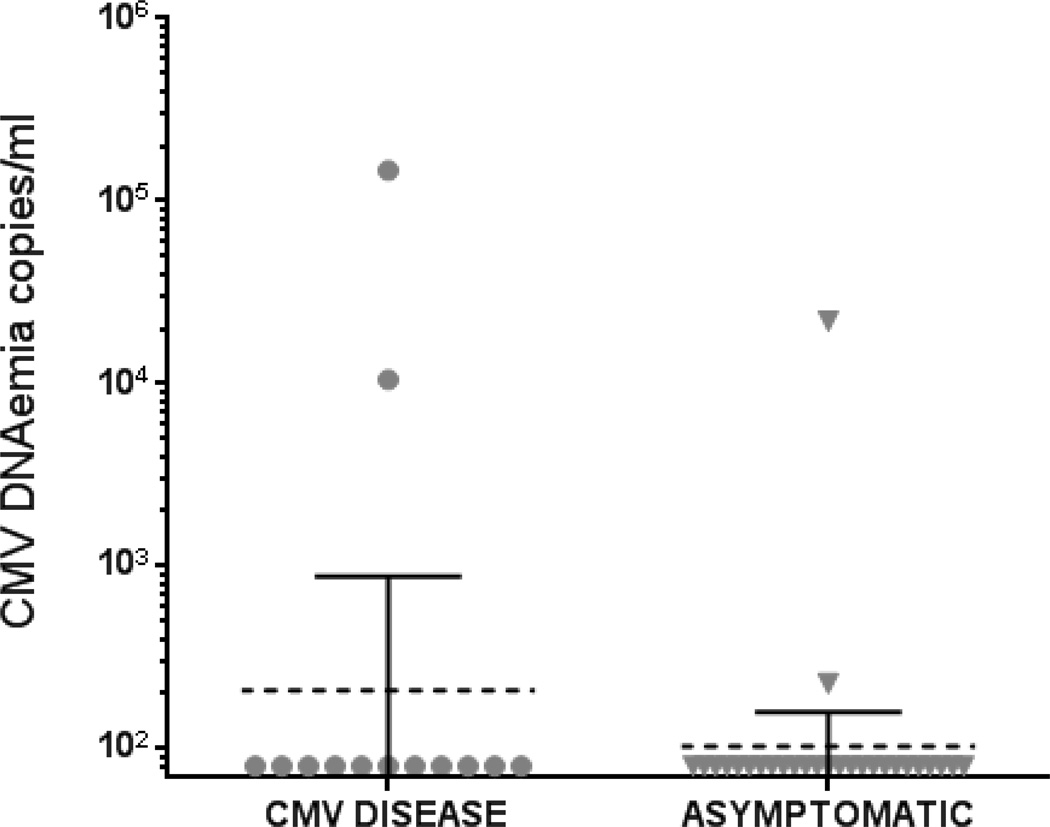
Figure 3.
Levels of CMV DNAemia as copies/ml measured within 1 month of antiviral prophylaxis discontinuation. The measurements obtained in the SOT recipient population are plotted for CMV-dz (N=13) and asymptomatic patients (N=27), as specified on the x axes of the scatter plots. The dotted bars represent the geometric mean and the filled bars, 95% confidence interval.

