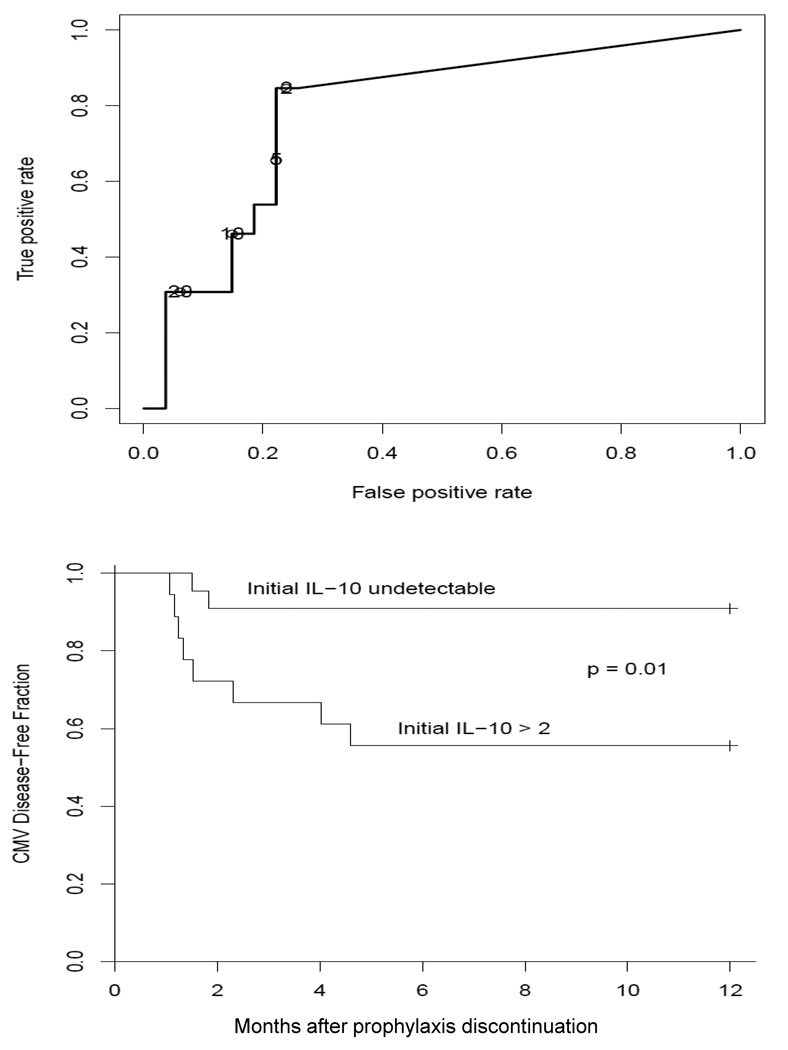
Figure 4.
In the upper panel, the ROC curve indicates sensitivity and specificity in predicting CMV-dz at different threshold of IL-10 levels. In the lower panel, a Kaplan-Meier curve separates the patients into two groups based on the presence/absence of measurable IL-10 levels at the first post-prophylaxis measurement (within 1 month of antiviral prophylaxis discontinuation), and compares estimates of the proportion of patients who remain CMV-dz free.

