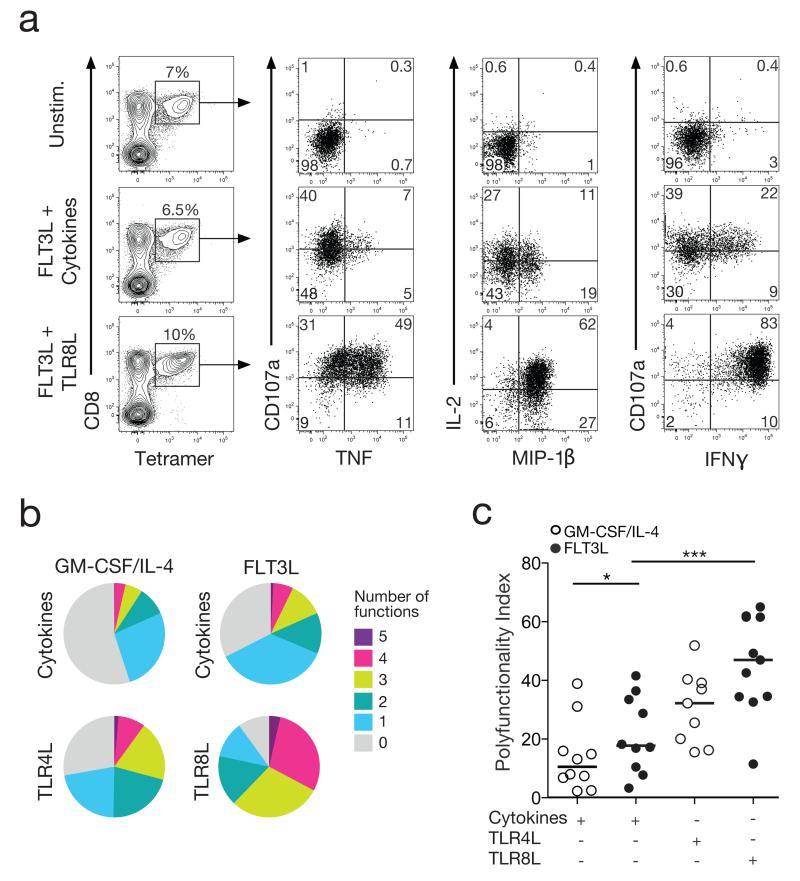
Figure 3. Polyfunctionality of FLT3L/TLR8L primed CD8+ T cells.
A. Representative flow cytometry plots showing cytokine production (IFNγ, MIP-1β, TNF and IL-2) and degranulation (CD107a) in response to antigen stimulation. ELA-specific CD8+ T cells primed under the indicated conditions were incubated with media alone (top row) or ELA peptide-pulsed HLA-A2+ B-LCL target cells (middle and bottom rows). Primed ELA-specific CD8+ T cells were quantified as tetramer+ cells within the total CD8+ population (left column). Function plots are gated on viable CD3+ CD8+ tetramer+ lymphocytes (middle and right columns). Numbers in each quadrant refer to the percentages of primed ELA-specific CD8+ T cells expressing the indicated combinations of functions. B. Averaged pie chart representations of background-adjusted polyfunctional profiles for ELA-specific CD8+ T cells primed under different conditions from 10 healthy donors. Pie segments and colours correspond to the proportions of ELA-specific CD8+ T cells expressing the indicated number of functions, respectively. C. Polyfunctionality indices for ELA-specific CD8+ T cell populations, calculated from the data depicted in (B). Horizontal bars indicate median values. Statistical comparisons between groups were performed using the Wilcoxon signed rank test; *P < 0.05, ***P < 0.001.

