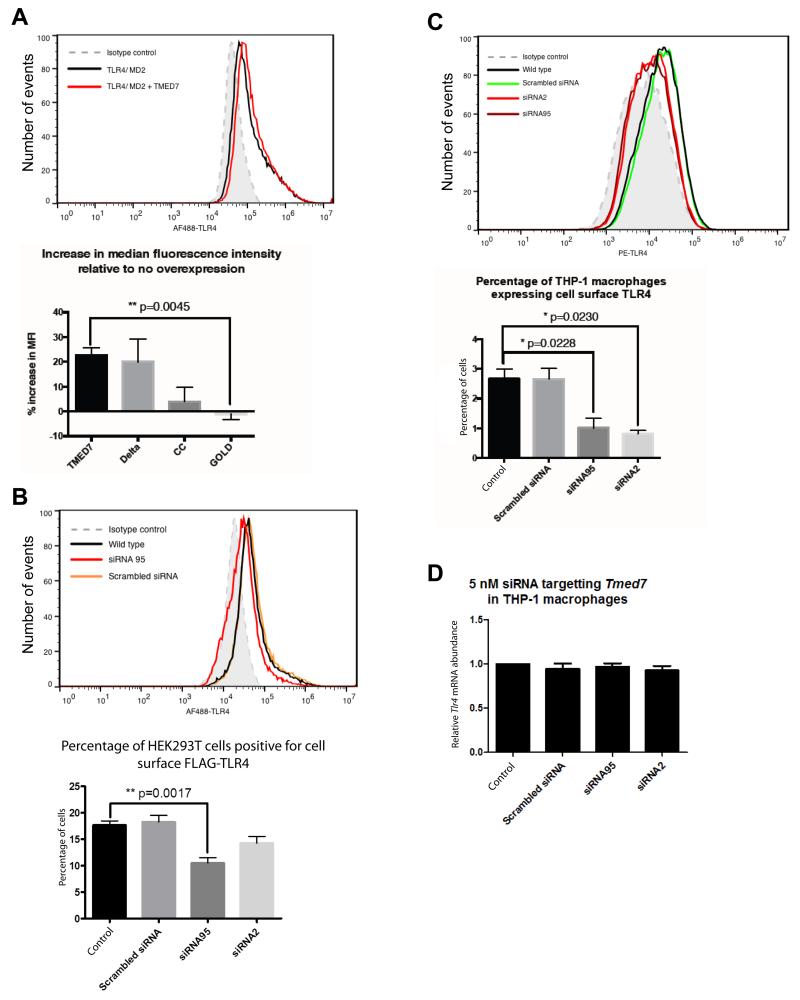
Fig. 8. TMED7 enhances the cell-surface abundance of TLR4.
(A) HEK 293T cells were transfected with plasmid encoding FLAG-TLR4 alone or together with plasmids encoding TMED7-HA or HA-tagged TMED7 truncation mutants. Cells were then analyzed by flow cytometry to determine the cell-surface abundance of TLR4. The histogram shows the change in the mean fluorescence intensity (MFI) corresponding to TLR4 upon TMED7-HA overexpression (compare red and black lines), bottom panel represents the increase in median fluorescence intensity (MFI) of cell surface TLR4 staining relative to no overexpression. (B) Knockdown of TMED7 in HEK 293T cells decreases the cell-surface abundance of FLAG-TLR4. HEK 293T cells were transfected with plasmid encoding FLAG-TLR4 alone or in the presence of the indicated siRNAs. 72 hours later, cells were analyzed by flow cytometry with an anti-FLAG antibody. The histogram is from a single representative experiment. Bar graph shows the mean ± SEM from three independent experiments. (C and D) Knockdown of TMED7 in THP-1 cells decreases the cell-surface abundance of endogenous TLR4, but not its total cellular abundance. THP-1 cells were left untreated or were transfected with the indicated siRNAs. 72 hours later, the cells were analyzed by flow cytometry with an anti-TLR4 antibody. The histogram is from a single representative experiment. Bar graph shows the mean ± SEM from three independent experiments. (D) THP-1 cells were left untransfected or were transfected with the indicated siRNAs. Three days later, cells were harvested and the relative amounts of Tlr4 mRNA compared to that of Actb mRNA were determined by qPCR analysis. Data are means ± SEM from three independent experiments. P values were calculated with an unpaired, two-tailed t test with Welch’s correction.

