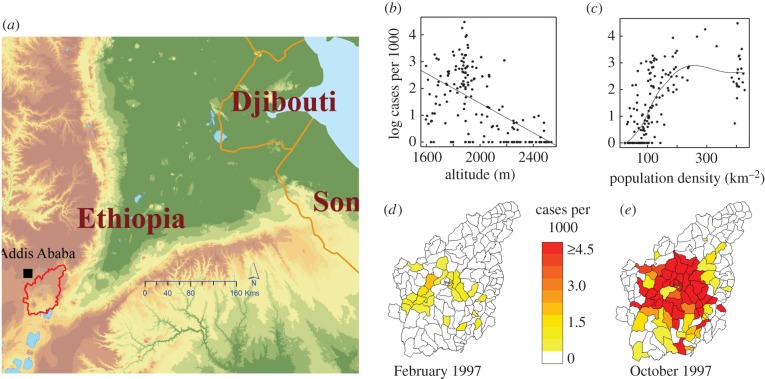
Figure 1.
Location of study area (a), log of number of P. falciparum cases per 1000 population in the low transmission season by altitude of kebele (b), and by population density of kebele (c). Illustration comparing the number of cases per 1000 population in two contrasting seasons—for the low (d) and high season (e), respectively (see also animation of monthly maps for the whole study period in the electronic supplementary material, video S1).

