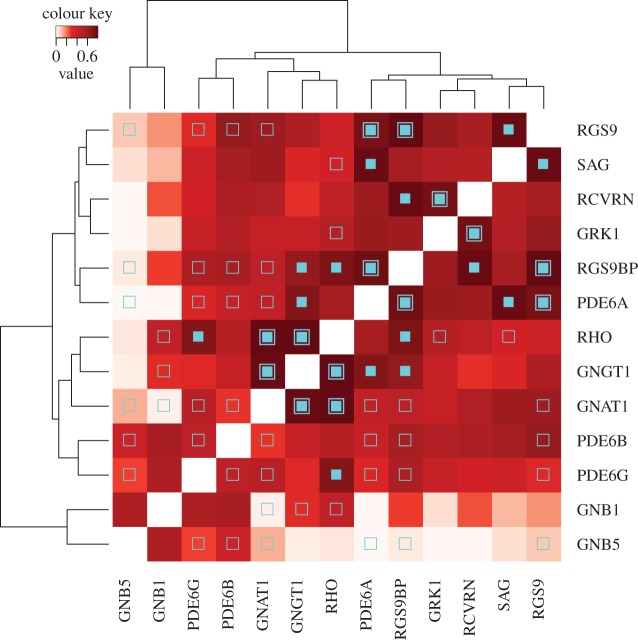
Figure 3.
Hierarchically clustered phylogenetic tree correlations between phototransduction genes. High correlation values (dark red) indicate evidence of coevolution between the pair. Open square symbols indicate pairs that physically interact (directly or via a molecular complex), closed squares indicate pairs that show statistically significant evidence of coevolution and closed squares nested within open squares indicate physically interacting pairs that show significant evidence of coevolution.

