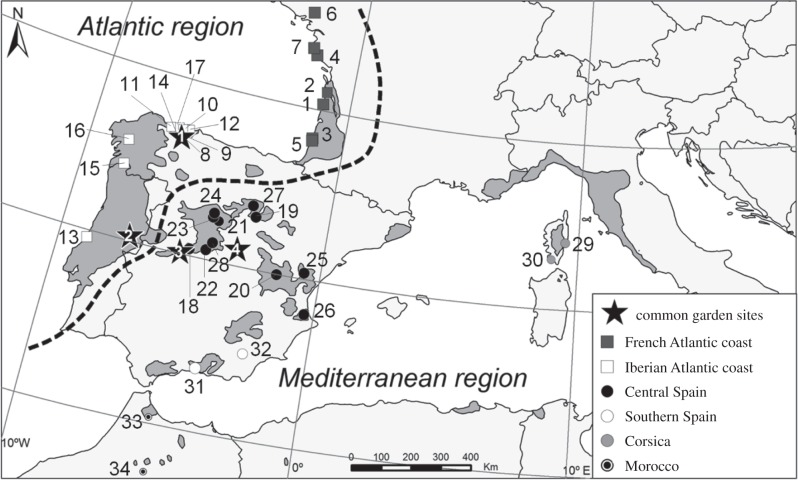
Figure 1.
Location of the four common gardens (stars) and the 34 source populations used to test for HFCs in P. pinaster. Populations are represented by numbers; see key in table 1. Symbols represent different gene pools as indicated in the legend. The size of the symbol is proportional to population mean heterozygosity (Ho) for 6100 SNPs. Shaded grey areas represent the species's natural distribution range.

