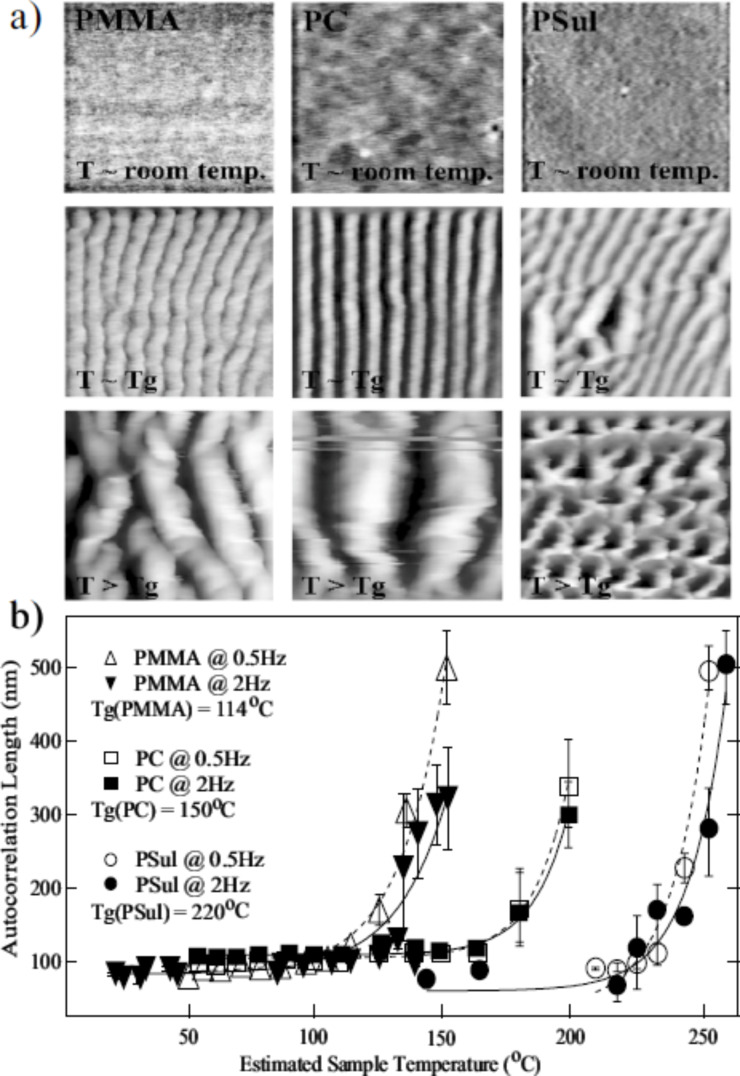
Figure 8.
(a) Topographical images (1 × 1 μm2) of nanoripples created by means of a resistively heated tip at various T values on PMMA, PC and PS films. (b) A plot of the autocorrelation lengths versus estimated T, derived from the images shown in (a). It reveals an exponential dependence with increasing T. The two sets of data per material have been obtained for v of 0.5 μm/s (dashed lines) and 2 μm/s (solid lines). Reprinted with permission from [22]. Copyright 2009 American Physical Society.

