
Figure 3.
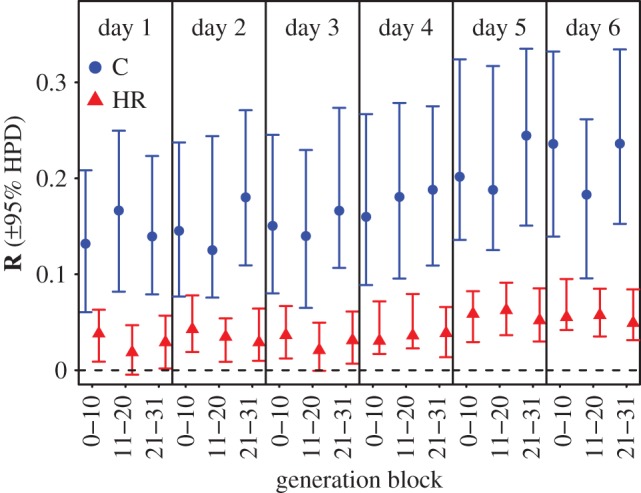
Predicted response to selection (R; in units of standard deviation) for wheel running on days 1–6 in control (C) and selected (HR) mice over different blocks of generations. The posterior modes and 95% HPD intervals incorporate the uncertainty from estimating both G (estimated separately for C and HR lines) and β (as estimated in HR lines). This figure shows the consequences of changes to G induced by directional selection (i.e. a large reduction in R in HR lines). However, for wheel running on days 5 and 6 (the selected traits), values of R were still significantly higher than zero even at the selection plateau (i.e. generations 21–31). (Online version in colour.)