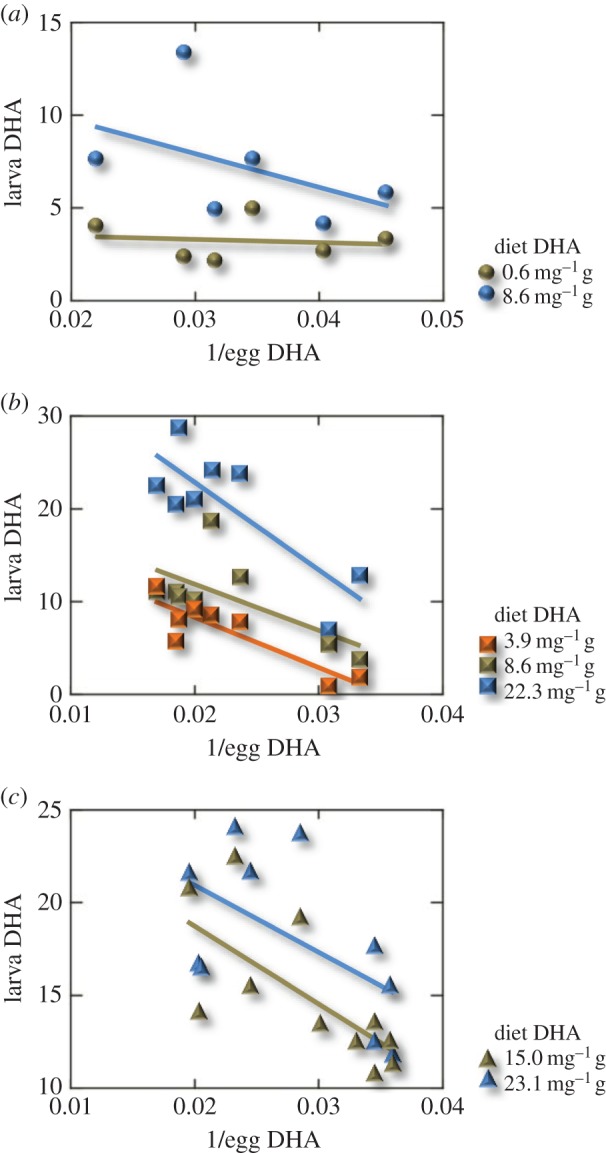
Figure 1.

DHA content of larval tissue in response to differences in DHA content of eggs and larval diet. (a) Experiment 1, N = 6 batches of eggs, each divided into two treatments. (b) Experiment 2, N = 8 batches of eggs, each divided into three treatments. (c) Experiment 3, N = 11 batches of eggs, each divided into two treatments. The inverse of egg DHA is plotted to linearize the relationships for statistical analysis. All DHA values are expressed in mg g−1 DW.
