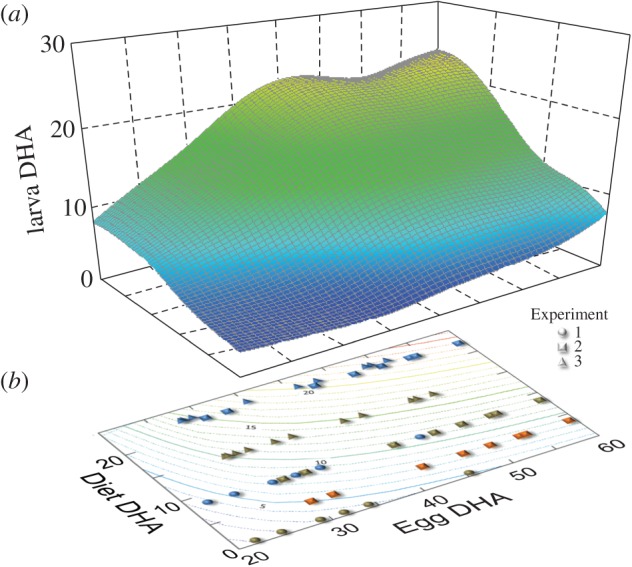
Figure 2.

Response of DHA content of larval tissue to DHA content of eggs and larval diet. Perspective plot (a) is fitted with a distance-weighted least-squares smoothing function. Contour plot (b) shows location of data points (N = 58) and contours of an approximation of the smoothed response surface (larval DHA = 8.14–154.51/egg DHA + 1.11 × diet DHA – 16.84 × diet DHA/egg DHA). All DHA values are expressed as mg g−1 DW.
