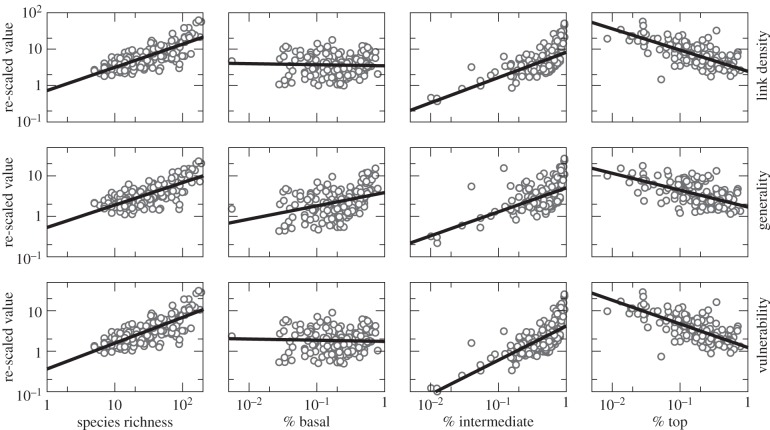
Figure 2.
Scaling relationships for re-scaled link density, generality and vulnerability relative to the species richness of a food web. Link density, generality and vulnerability were each re-scaled to remove the effects of latitude and ecosystem type. As these relationships take the form of power laws, we did this by dividing the food-web property (e.g. link density) by species richness raised to an exponent including the effects of latitude and, where applicable, ecosystem type and the interaction between ecosystem type and latitude. Note that in all cases estuarine food webs were treated as the baseline ecosystem type, but that at most two ecosystem types had interactions between ecosystem type and latitude retained in the best-fitting model (see Results for specifics). For each relationship, we show the re-scaled values (white circles) as well as the overall scaling relationship using estuarine ecosystems as a baseline (black line; n = 196 food webs). For a figure with the uncorrected values, see the electronic supplementary material, figure S7 and appendix S4.

