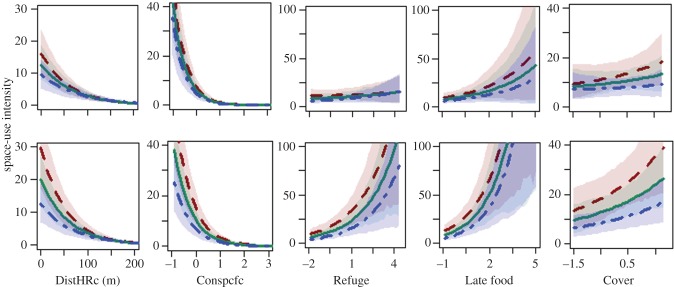
Figure 3.
Selected interactions between quadrat properties and lizards' aggressiveness during the Early (upper row) and Late (lower row) seasons. Predictors: distance from HR centre (DistHRc) and Z-scores of use intensity by conspecifics (Conspcfcs), Refuge rank, Late food availability, and Cover of annuals (see the electronic supplementary material, figure A6 for the full list). Each panel presents model predictions for non-aggressive lizards (red dashed line), the average lizard (green solid line) and aggressive lizards (blue dashed-dotted line) using the mean value for each tercile (0–33%, 33–66%, and 67–100%). The shaded areas are the confidence intervals of the predicted λ of the Poisson distribution for each tercile. Overall, aggressiveness had stronger interactions with ecological predictors during the Late season. (Online version in colour.)

