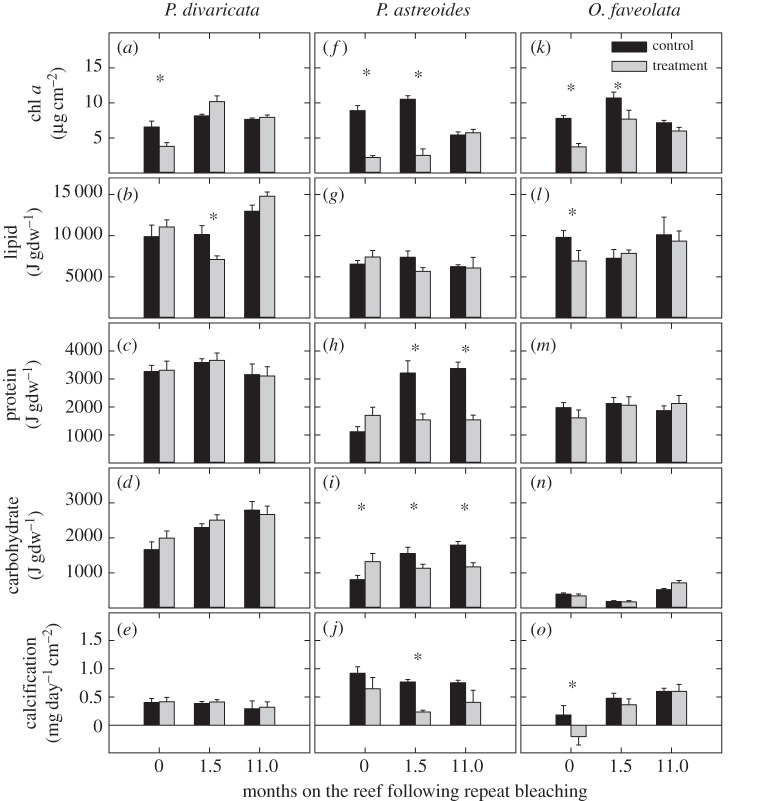
Figure 1.
Average chlorophyll a (chl a), lipid, protein, carbohydrate and calcification rates of (a–e) Porites divaricata, (f–j) Porites astreoides and (k–o) Orbicella faveolata after 0, 1.5 and 11 months on the reef following repeat bleaching. Averages are shown ±1 s.e. Asterisks indicate significant differences between treatment and control corals within a time point and species. Sample size per average ranges from 5–9. Statistical results shown in the electronic supplementary material, table S2. Chl a and calcification values at both 0 and 1.5 months on the reef are reproduced from Schoepf et al. [29] and Grottoli et al. [9], respectively.

