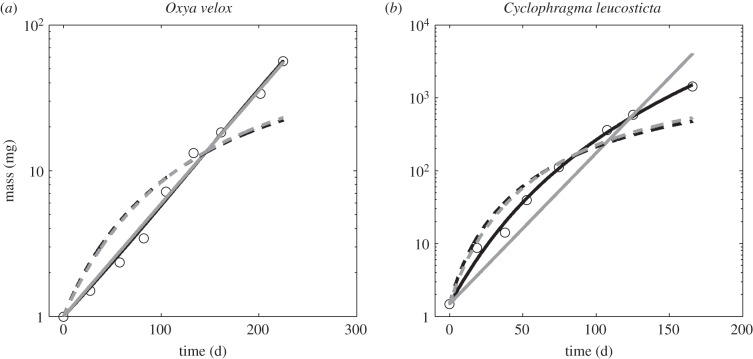
Figure 3.
(a,b) Representative fits of the four models where the solid black line is the DEB model, the solid grey line is the exponential model, the dashed black line is von Bertalanffy growth and the dashed grey line is the WBE model. The insect DEB model captures not only the exponential growth but also the curvature on a semi-logarithmic plot.

