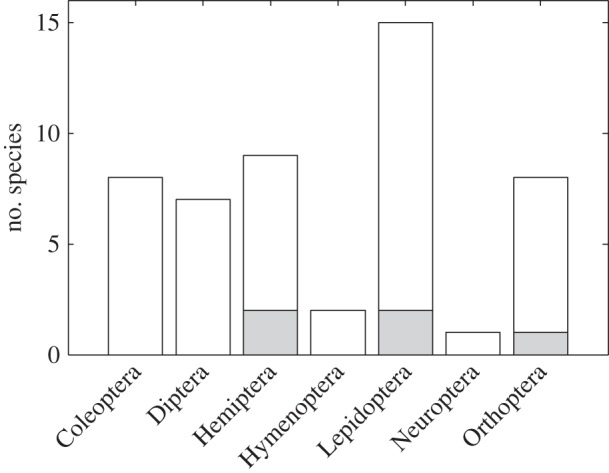
Figure 4.

Best models for individuals within orders as determined by AIC values. White bars denote number of individuals for which DEB model produced the lowest AIC value, while grey bars are cases where the exponential model was best. The von Bertalanffy model and the WBE model were not the best model for any species.
