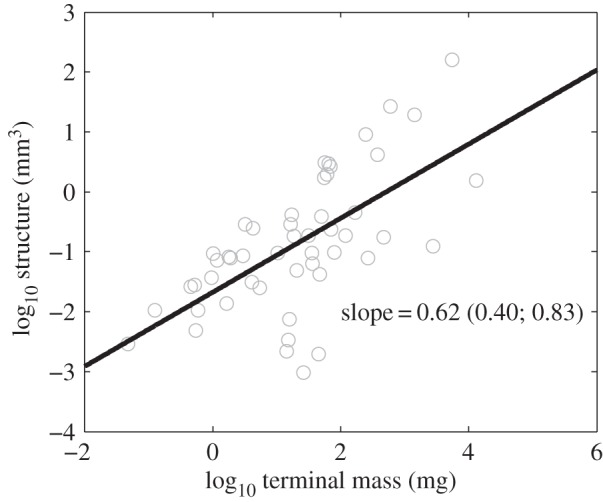
Figure 6.

Terminal structure is determined from the fitted DEB models for each species (equation (2.8)) and is plotted against species terminal mass. The 95% CI of the regression slope (in parentheses) excludes 1, supporting the prediction that structure scales sublinearly with the mass of a species.
