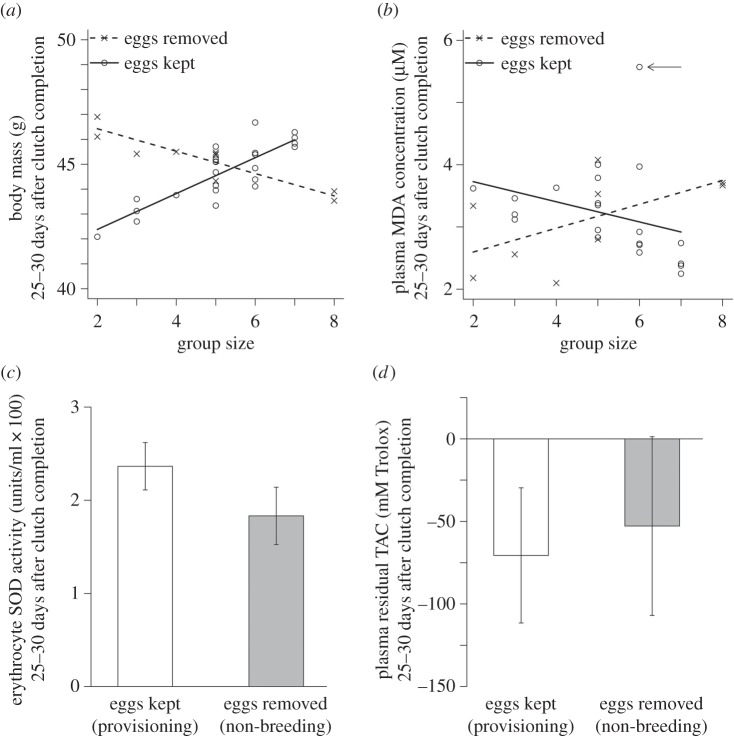
Figure 1.
The effect of experimental clutch removal on (a) body mass (a significant interaction between treatment and group size), (b) plasma MDA concentration (a significant interaction between treatment and group size), (c) erythrocyte SOD activity (no significant effect of treatment), (d) plasma residual TAC (no significant effect of treatment). In (a,b), the lines represent linear mixed effect model predictions, and the points represent model residuals. In (a), the model contained clutch completion mass and the interaction between group size and treatment as predictors, and social group ID as the random effect. The predictions are for an individual of mean clutch completion body mass (44.75 g). In (b), the model contained the interaction between group size and treatment as the predictor, and social group ID as the random effect. The outlying high MDA value indicated by an arrow is not driving the interaction; its removal enhances the significance of the interaction (see results). In (c,d), bars represent the predicted means (± s.e.) for treatment in the minimal adequate model. In (d), the residuals are not distributed around zero as they were calculated using a dataset that also included the clutch completion TAC values, and the clutch completion residual TAC measures for all individuals are higher than their final residual TAC measures. Sample sizes, body mass: eggs removed (n = 10 birds from seven social groups), eggs kept (n = 24 birds from 11 social groups); MDA: eggs removed (n = 9 birds from seven social groups), eggs kept (n = 22 birds from 10 social groups); SOD: eggs removed (n = 10 birds from seven social groups), eggs kept (n = 21 birds from nine social groups) and residual TAC: eggs removed (n = 8 birds from six social groups), eggs kept (n = 14 birds from eight social groups).

