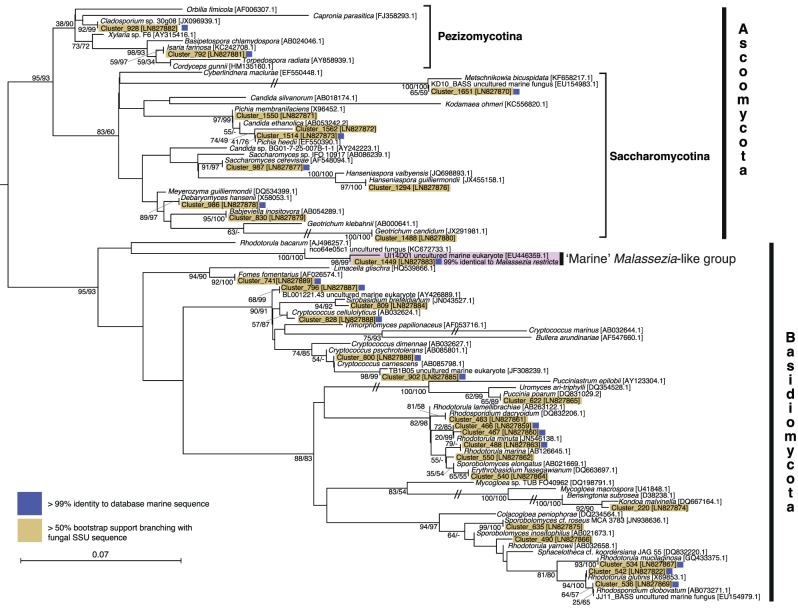
Figure 2.
Phylogeny of the Dikarya marine OTU clusters. ML phylogeny calculated from an alignment of 94 sequences and 342 positions. Bootstrap values from both 1000 ML and 1000 Log-Det distance pseudo-replicates are shown when >50%. Branches with a double slash mark indicate a branch reduced in length by 1/2. Blue squares next to each sequence indicates OTU clusters which have >99% identity to a database sequence from a marine environment.

