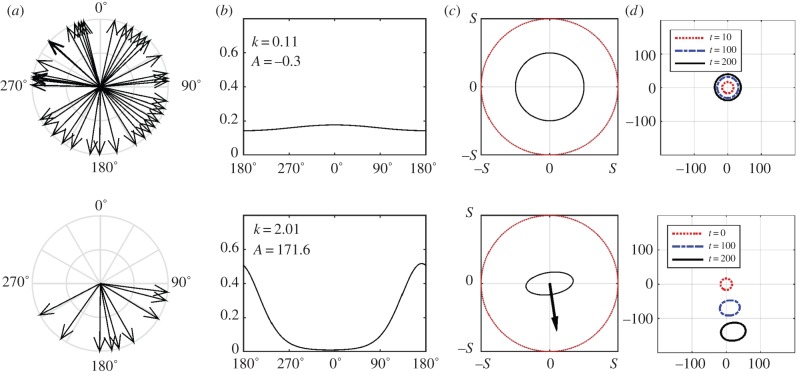
Figure 2.
Translation from circular datasets to macroscopic terms for (top) unbiased and (bottom) biased populations. (a) Datasets, with each angular entry indicated by an arrow; (b) von Mises distribution (3.3) and its two defining parameters; (c) advective velocity (a) and diffusion tensor ( ) representations, calculated from equation (3.4); (d) simulations of equation (2.3). For simulations, we plot the contour line of constant density (=10−4) at successive times for a population initiated at the origin. (Online version in colour.)

