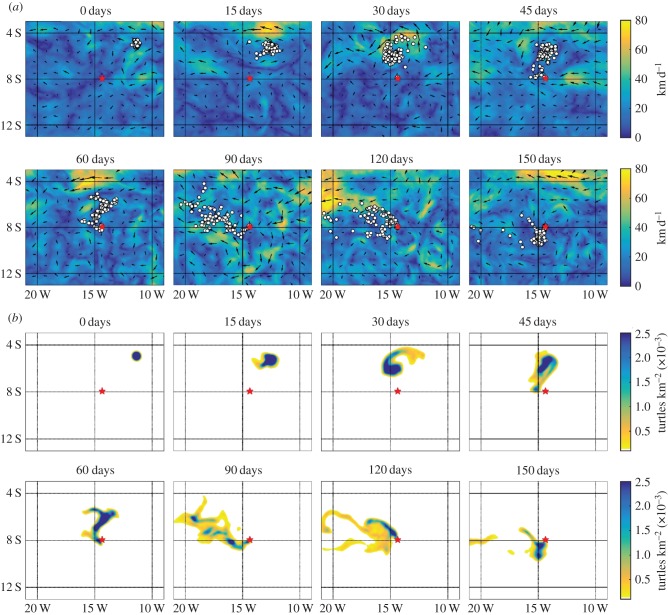
Figure 7.
Comparison between the IBM and macroscopic model. (a) IBM: 100 individuals are released at time zero at the NE location. In each subplot, we show their positions (white circles) at the indicated times, superimposed on ocean currents. Current data are illustrated by its direction (arrows) and magnitude (arrow length/density map). Here, we consider a slower navigator (s = 30 km d−1, k = 1); for other parameters, see text. (b) Macroscopic model (2.3) under the same initial set-up, parameters and ocean currents. m(t, x) indicated by density map, where the scale indicates the number per square kilometre; white regions represent a density below 10−4. The red star marks AI. (Online version in colour.)

