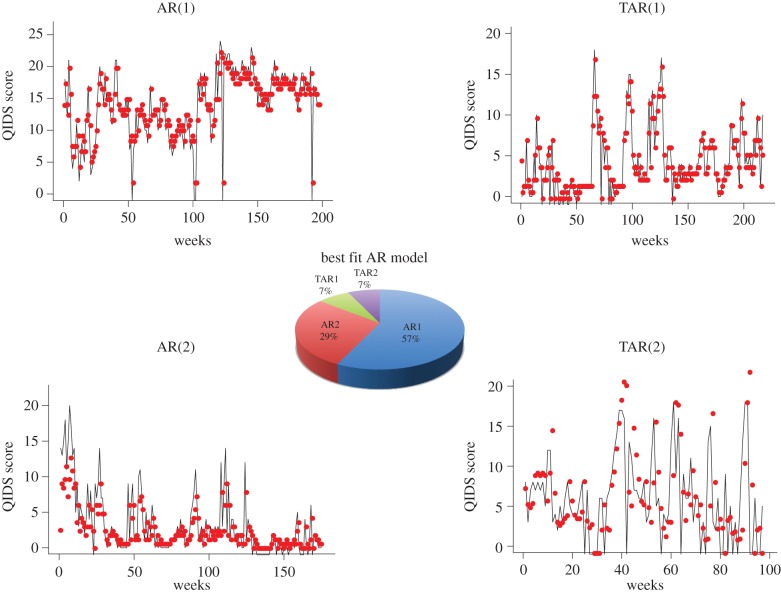
Figure 3.
Descriptive time-series analysis using AR models. From 42 individual time series, over half (57%) are described by single lag AR process. One-third (29%) are described by two lag AR process. Threshold AR processes (which described different dynamics above and below average model score) describe 14% of the time series. Representative fits of each of the AR processes (red points based on one-step ahead predictions) to the mood fluctuation time series (solid black lines) are shown.

