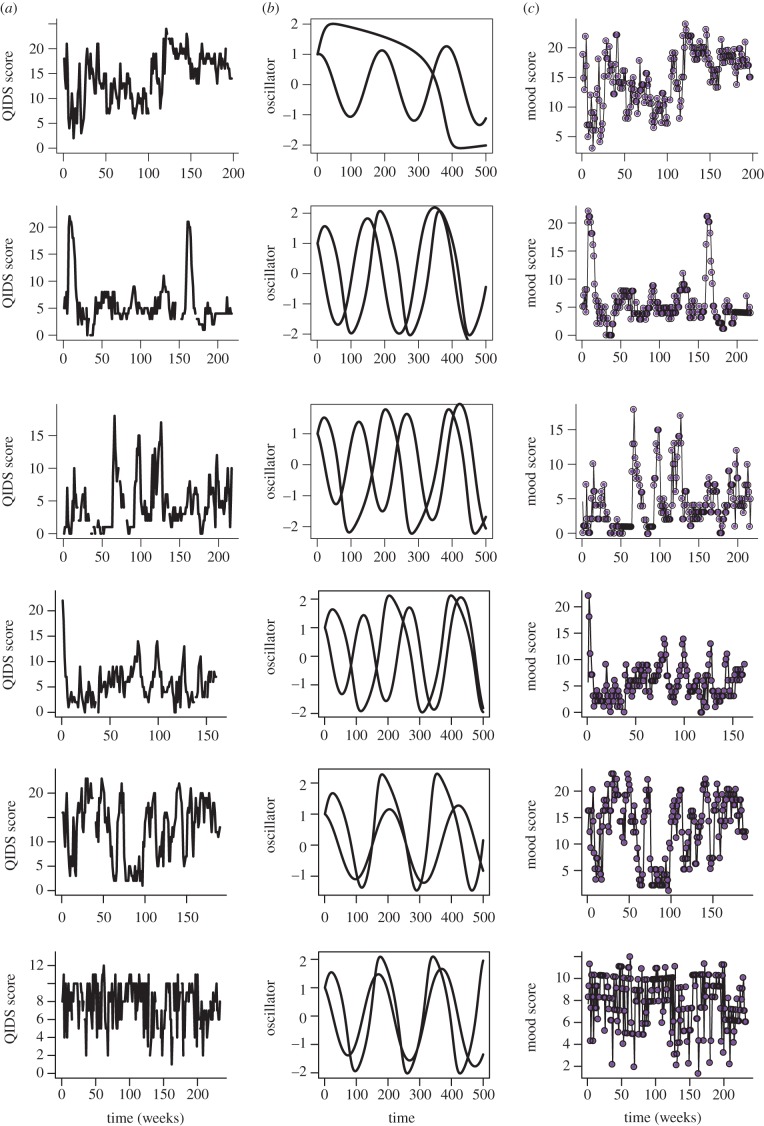
Figure 4.
Illustration of predicted RO dynamics. Observed mood fluctuations (QIDS scores), predicted RO dynamics and predicted fit to QIDS scores for six participants (whose dynamics are described by two independent ROs). (a) Time series of observed mood dynamics (QIDS scores). (b) Predicted RO dynamics from numerically integrating equations (2.1) and (2.2). Parameters a and b are derived from the maximum-likelihood fitting of equation (2.9) to the observed mood dynamics. (c) Predicted mood dynamics (from the total derivative (equation (2.9))) determined by using each observed QIDS score to predict the next mood score. Again, parameters (α, β and γ) are derived from the maximum-likelihood fit of equation (2.9) to the overall observed mood dynamics.

