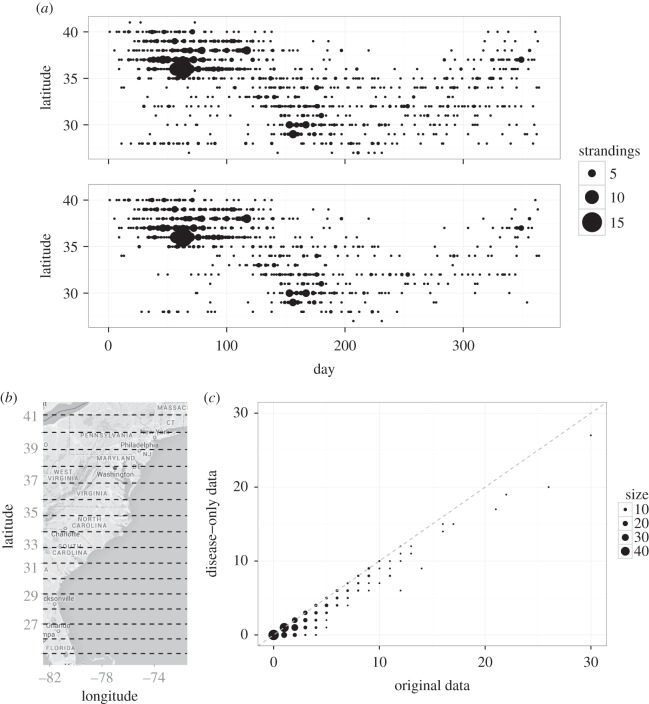
Figure 1.
(a) Strandings by latitude and day since the start of the epidemic (from June 2013 to 2014) for the original UME data (top panel) and the new epidemic dataset generated by removing background cases (bottom panel). The size of each point indicates the number of strandings. (b) Map of the United States NW Atlantic coast with latitude bands highlighted by dashed lines (for reference). (c) Comparison of the new epidemic (disease-only data) and original UME datasets. Each point compares the number of strandings on a given day and latitude band between both datasets, with size indicating the number of times that particular coordinate combination occurred. The dashed line indicates when both are equal.

