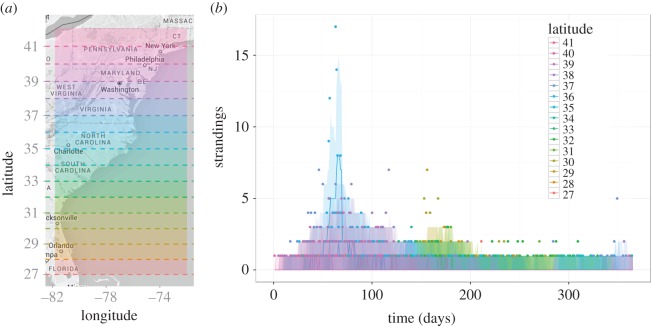
Figure 2.
(a) Map of the United States NW Atlantic coast with latitude bands highlighted by dashed lines and shaded regions (for reference). (b) Simulated predictions of the frequency-dependent model with location-specific transmission rate. Cases were simulated across latitudes, l, and time, t, as Pois(λl,t) using the hazard function calculated during parameter estimation. Lines represent median values from 2000 simulations in RStan, shaded regions represent the 2.5th–97.5th quantile range and points represent actual data. In both panels, latitude bands are highlighted by the same colour.

