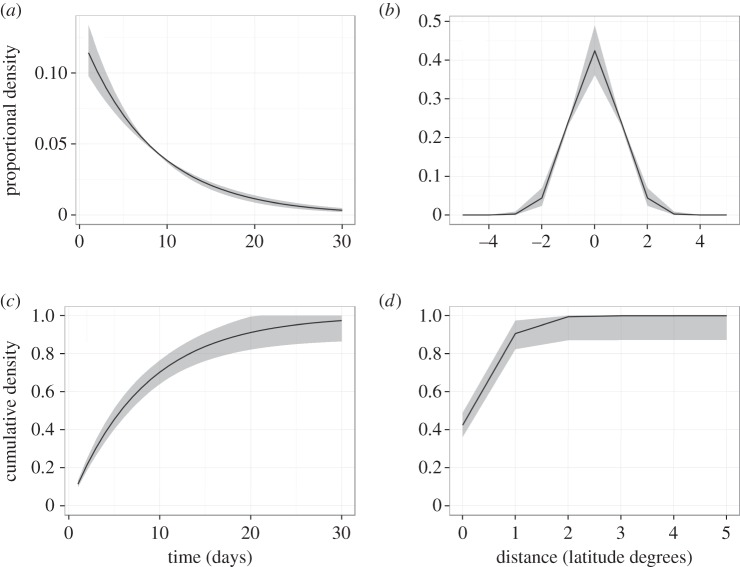
Figure 3.
Individual infectiousness functions from the frequency-dependent model with location-specific transmission rate. Probability distributions for the temporal (a) and spatial decay functions (b). Cumulative distributions for the temporal (c) and spatial decay functions (d). Solid black lines are median values of 2000 simulations in RStan and grey shaded regions represent the 2.5th–97.5th quantile range.

