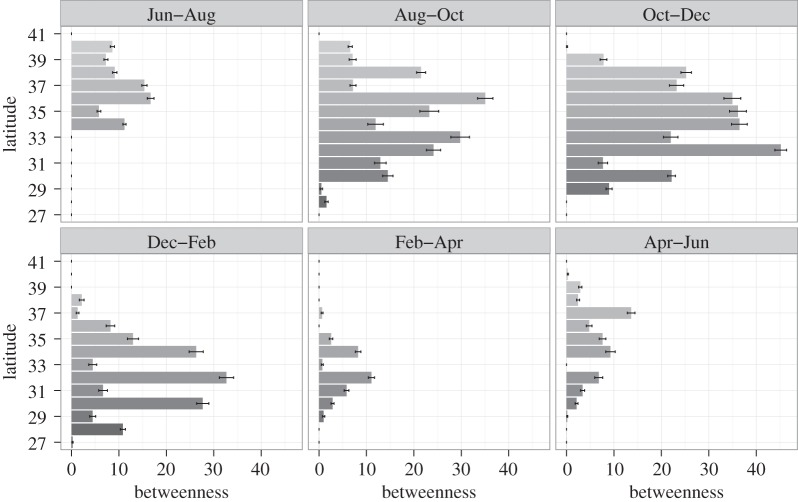
Figure 5.
Betweenness of each latitude band in the reconstructed transmission networks across bimonthly intervals, starting 26 June 2013 (darker colours represent more southerly latitude points). Betweenness measures the number of shortest paths running through a particular node for each of the sampled networks. Mean values (grey shaded bars) and standard error bars (black lines) are calculated from 100 sampled network trees.

