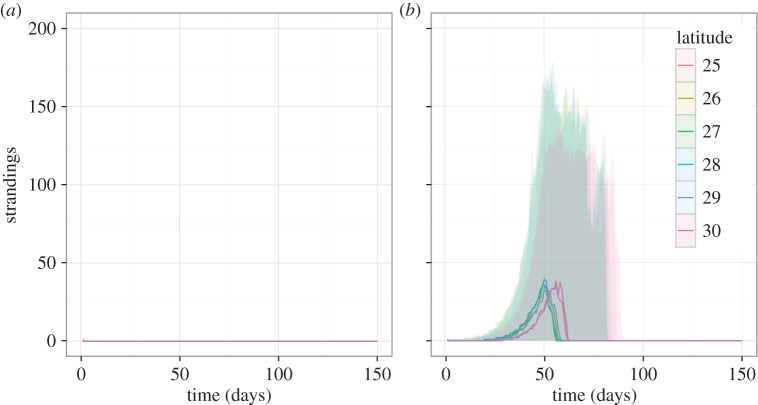
Figure 6.
Simulations of an outbreak initiated in the GoM using parameters obtained from the best-fitting model. (a) Best-case scenario using the baseline reproduction number (R0 = 0.95). (b) Worst-case scenario using the increased reproduction number ( ). Solid lines represent median values of 100 simulations and shaded regions represent the 2.5th–97.5th quantile range. Latitude bands are distinguished by colour.

