
Figure 3.
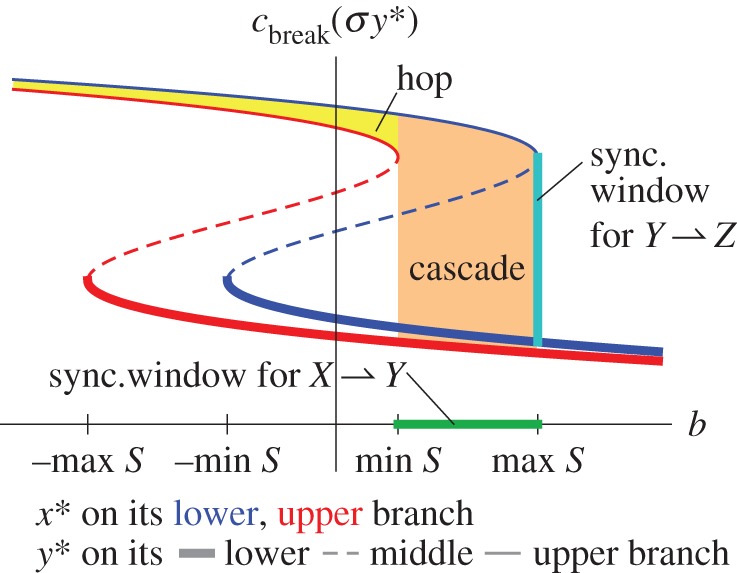
Catastrophes can cascade, or they can hop over intermediate systems. The two backward-S-shaped curves are plots of the break point cbreak(σ y*) of the downstream system Z (equation (2.3)) as a function of the slow parameter b of the intermediate system (2.2b) for coupling strength σ = 0.2. The two curves show the effect of the master parameter a increasing past its break point abreak, at which time we change focus from the blue, right-hand curve to the red, left-hand curve. Thick curves (respectively, thin curves, dashed curves) correspond to the intermediate system y* on its upper stable branch (respectively, lower stable branch, middle unstable branch). As in figure 2b, the green line segment marks the synchronizing window S for X and Y (the values of b such that, when a crosses abreak, the intermediate system Y passes its break point bbreak(σ x *)). The cyan line segment marks the analogous interval for Y and Z (for a = abreak). The orange and yellow regions are values of (b,c) leading to sequences of regime shifts that cascade or that jump over Y, respectively.