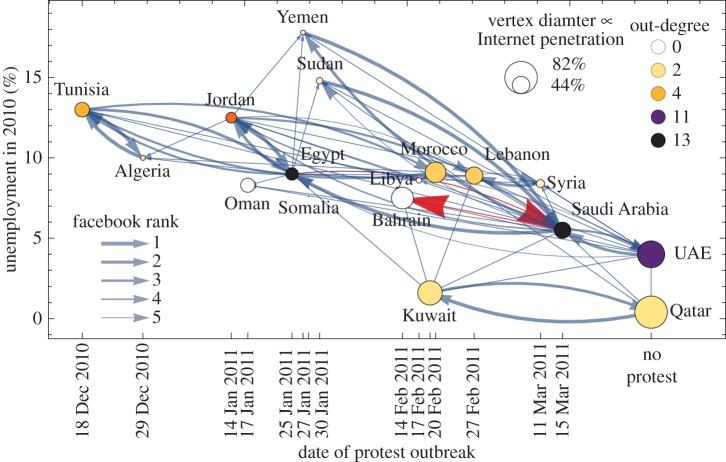
Figure 4.
Exploration of the roles of proximities to tipping points and coupling (cross-border communication) for countries involved in the Arab Spring. Shown is the unemployment in 2010 [77] versus the date at which protests began [80] (table 3) for 16 countries that had protests, plus Qatar and the UAE. The best-fit line has slope −0.5% per week (p-value 0.06, R2 = 0.25; UAE and Qatar ignored). The direction of the Facebook edges [79] captures the spread of influence to protest: an edge from i to j means that i is among j's five countries with which j has the most Facebook friends (in the year 2012); edge thickness decreases linearly with rank, so the thickest edges correspond to rank one (the strongest coupling). Vertex colour denotes out-degree; high out-degree nodes (e.g. Egypt and Saudi Arabia) may be particularly influential in spreading influence to protest via Facebook. Highlighted in red edges with large arrowheads is one cascade hop motif, Egypt → Saudi Arabia → Bahrain (see definition 3.1 for the definition and table 2 for the other nine hop motifs). A version of this plot with a few more countries that protested much later than the dates shown here is in the electronic supplementary material, figure SM-3.

