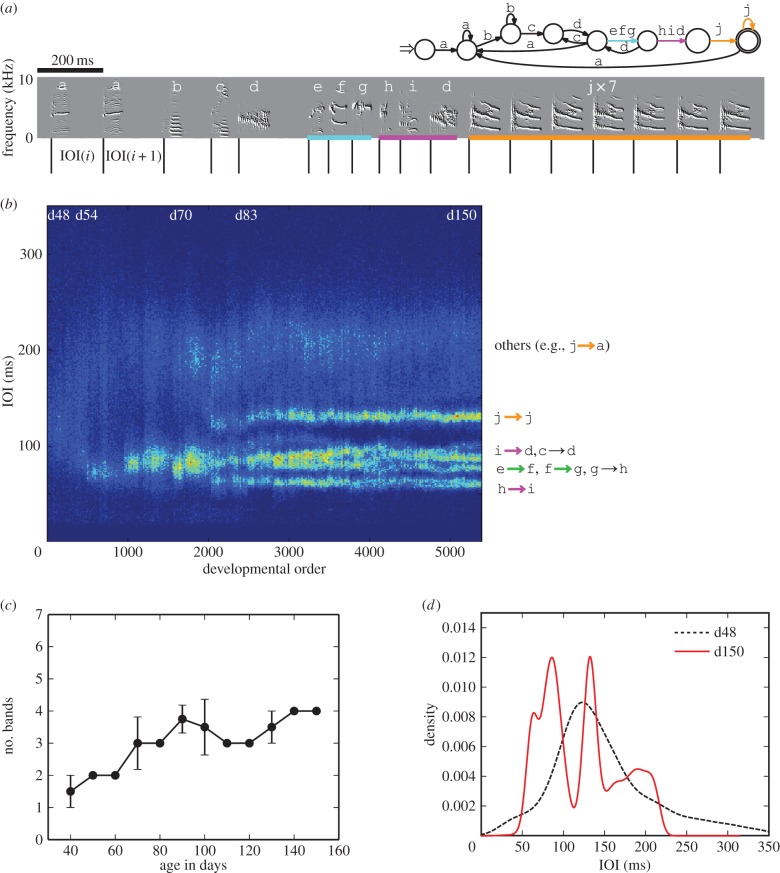
Figure 1.
Bengalese finch song and its rhythm landscape (bird1). (a) A variegated song and its song syntax (transition diagram) constructed as previously described [17] from 30 songs in the last recording. Letters denote note types and colours correspond to different chunks. Black vertical lines denote note onsets and intermediate spaces denote IOIs. (b) Two-dimensional visualization of the rhythm landscape, where the brighter points denote higher density (N = 521137). (c) Development of the number of bands in (b) (mean ± s.d.). (d) IOI distributions for day 48 and 150 after hatching.

