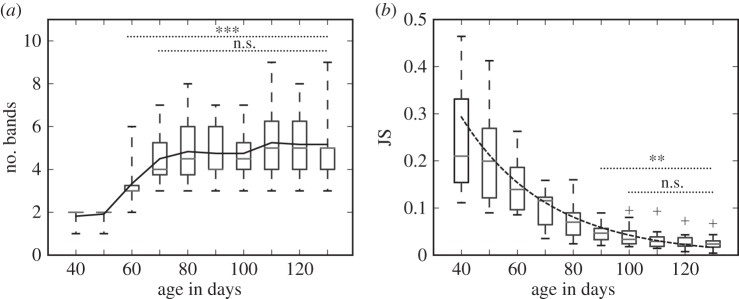
Figure 2.
Common properties of rhythm landscapes. (a) Boxplots of the number of bands averaged per individual by 10 days from day 40 after hatching. (b) Box plots of JS values (i.e. dissimilarity to the crystallized song) averaged per individual by 10 days from day 40 after hatching, with the best exponential fit. The significances refer to differences between day 130 and before that.

