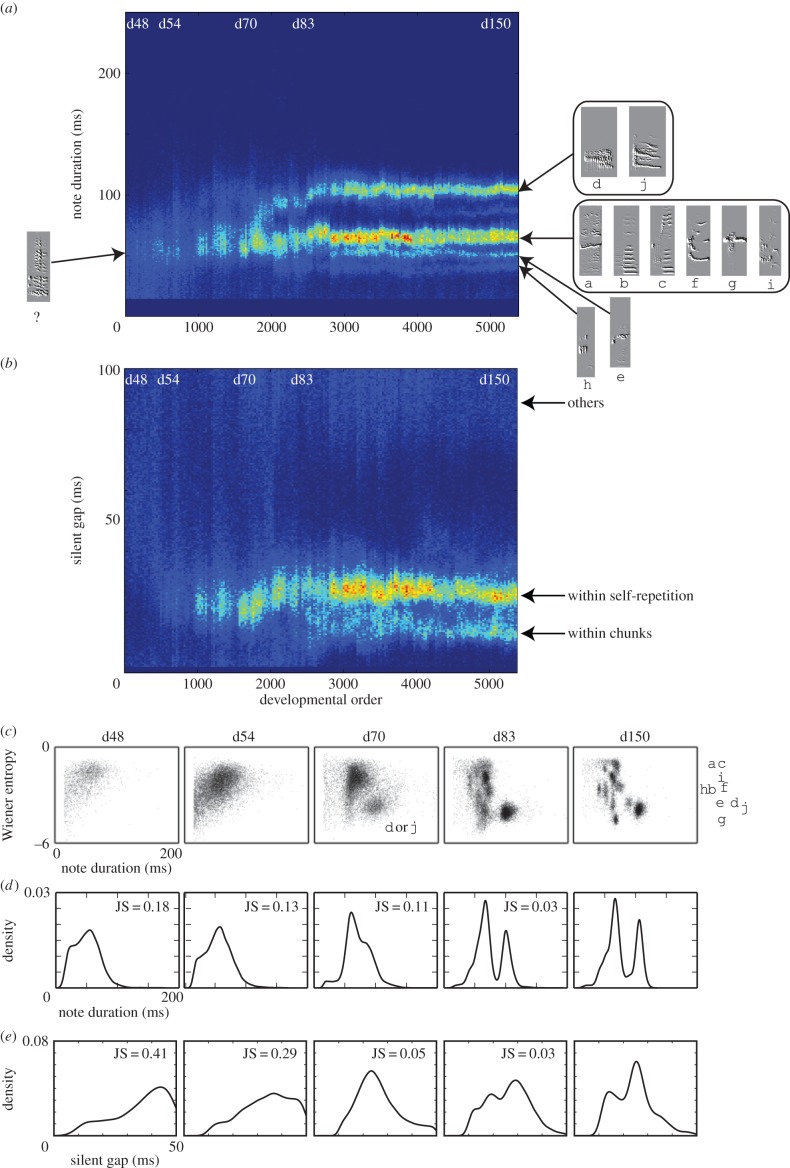
Figure 4.
Song changes at the substring level (bird1). Two-dimensional visualization of developmental landscape for (a) note duration (N = 540227) and (b) silent gaps (N = 480561). (c) Scatter plots of Wiener entropy against note duration, showing the differentiation of 10 note types from a primitive vocalization. Distribution of (d) note duration and (e) silent gaps at different days.

