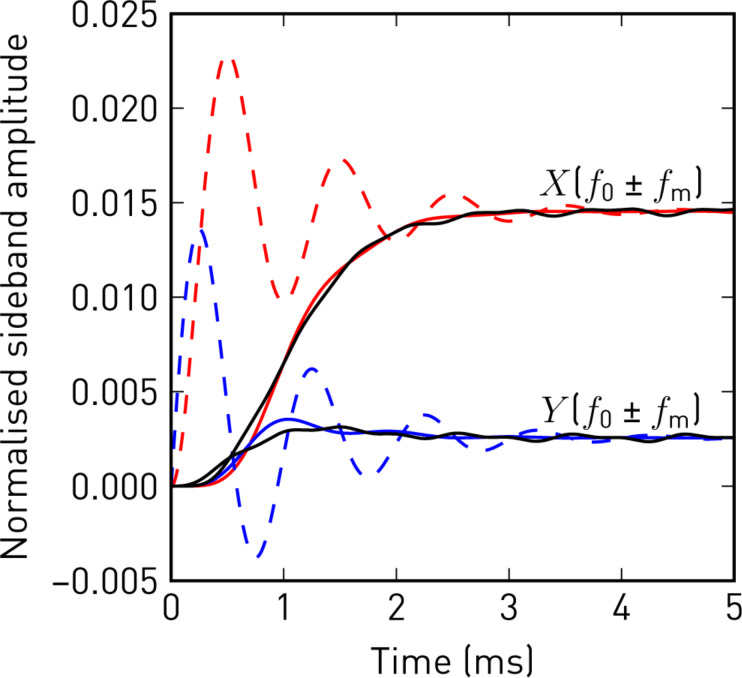
Figure 3.
In-phase (red) and quadrature (blue) sideband amplitudes, normalised to the carrier oscillation amplitude A, in response to a step in the force gradient modulation amplitude. The step responses following from Equation 8 (dashed), show oscillations at fm, exponentially decaying with 1/ωc, which are removed by the low-pass filter of the lock-in amplifier (solid, fcut = 250 Hz, 24 dB/oct). The solid black lines show the demodulated sideband amplitudes from a direct numerical simulation of the perturbed harmonic oscillator. (Numerical parameters: f0 = 70500 Hz, Q = 200, A = 10 nm, fm = 1000 Hz, φk = 0,  = 30 Hz).

