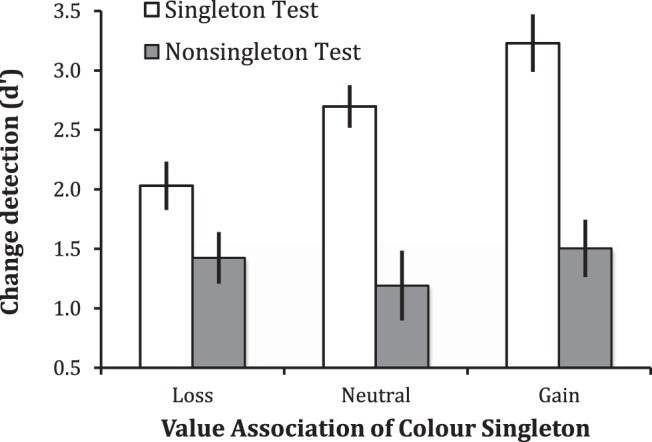
Figure 2.

Group mean working memory performance (d′) when the singleton (open bars) or nonsingleton (gray bars) face was tested after viewing an array in which the color singleton had the gain-, loss-, or no-outcome-associated color. Vertical lines indicate ±1 within subject standard error.
