
Figure 5.
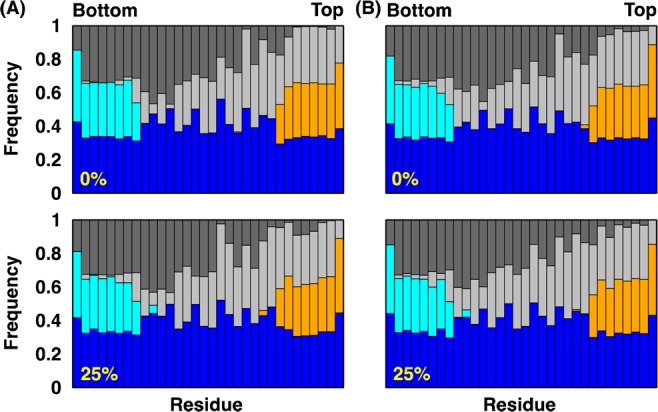
Interaction patterns of gA residues and their environment in (A) gA-DMPC and (B) gA-POPC bilayers at 0% (upper panels) and 25% (lower panels) mismatches. The graph shows, for each residue, the frequency of occurrence within 4.5 Å of water (blue), headgroup (cyan) and tail (dark gray) in the lower leaflet, and headgroup (orange) and tail (light gray) in the upper leaflet.