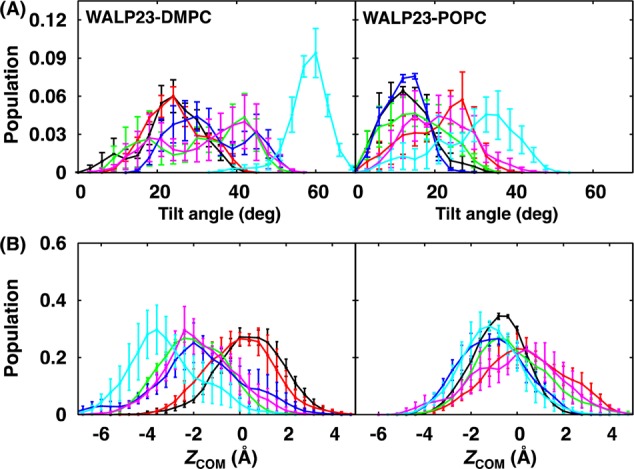
Figure 7.

(A) Tilt angle and (B) ZCOM distributions of WALP23 in DMPC and POPC bilayers at various mismatches between NT and NB: 0% (black), 5% (red), 10% (green), 15% (blue), 20% (magenta), and 25% (cyan). The error bars are the standard errors calculated from three block averages.
