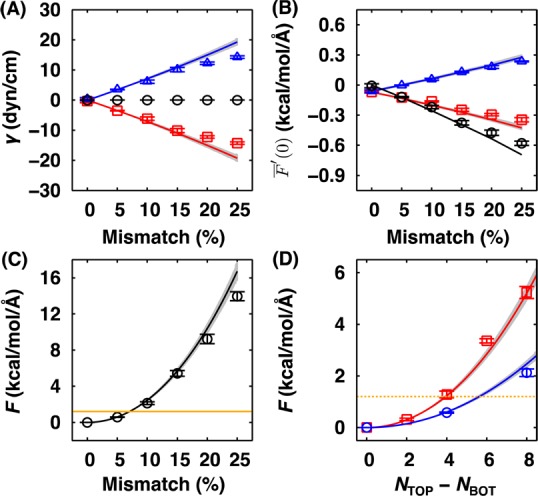
Figure 9.

(A, B) The surface tension and the free energy derivative at planar curvature at various mismatches for pure DMPC bilayer with NT = 80, where the leaflet properties are shown in red (upper) and blue (lower), and bilayer properties are shown in black: (A) The surface tensions, γ (circle), γT (square), γB (triangle), and the estimates calculated from eq 8 (lines); (B) The free energy derivatives at planar curvature, F̅′(0) (circle), F̅T′(0) (square), and F̅B′(0) (triangle) and the estimate of these derivatives calculated from eq 9 (lines). (C, D) The energetic penalty due to SA/lipid mismatch estimated from eq 11 (symbol), the prediction from eq 10 (line), and an energy level, 2kBT (orange line):50 (C) the energetic penalty for pure DMPC bilayer with NT = 80 and (D) the energetic penalty for pure DMPC bilayers with different sizes, NT = 40 (red square) and 80 (blue circle). In all the panels (A–D), the error bars are standard errors from three block averages, and the gray area represents the region within one standard error of the predicted line.
