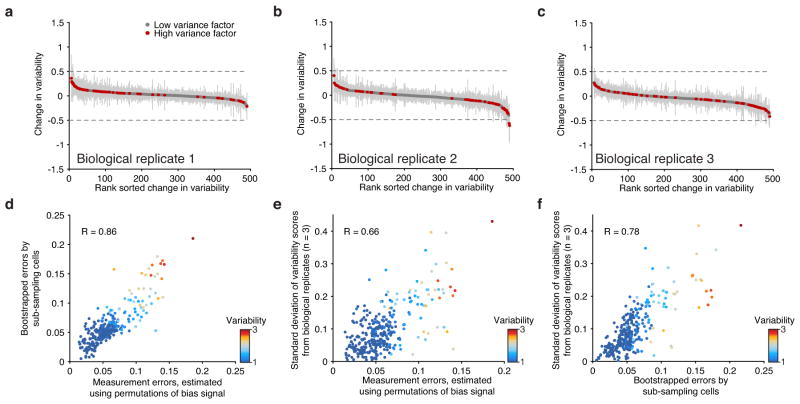
Extended Data Figure 5. Biological replicates and measurement error analysis.
(a–c) Observed changes in variability comparing the merged set of replicates (K562) to each individual biological replicate. Error bars represent 1 standard deviation of the variability scores after bootstrapping cells from each replicate. (d–f) Correlation of errors computed using three distinct approaches.

