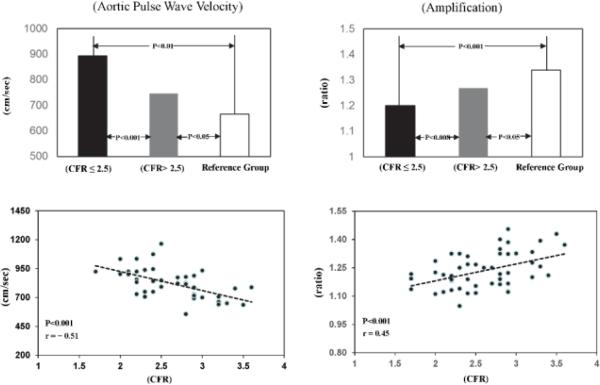
Figure 2.
Above: Average values of aortic pulse wave velocity (N = 43) and pulse pressure amplification (N = 50) in WISE women with CFR ≤2.5 (dark bar) compared with those with CFR >2.5 (grey bar) and a reference group of women (N = 59) (open bar). P values are shown for CFR ≤2.5 vs Reference Group; CFR ≤2.5 vs CFR >2.5; CFR >2.5 vs Reference Group.
Below: Scattergrams and linear regression lines for aortic pulse wave velocity and pulse pressure (PP) amplification brachial PP/aortic PP plotted against CFR in all WISE women. The same format is used for figures 3 and 4.

