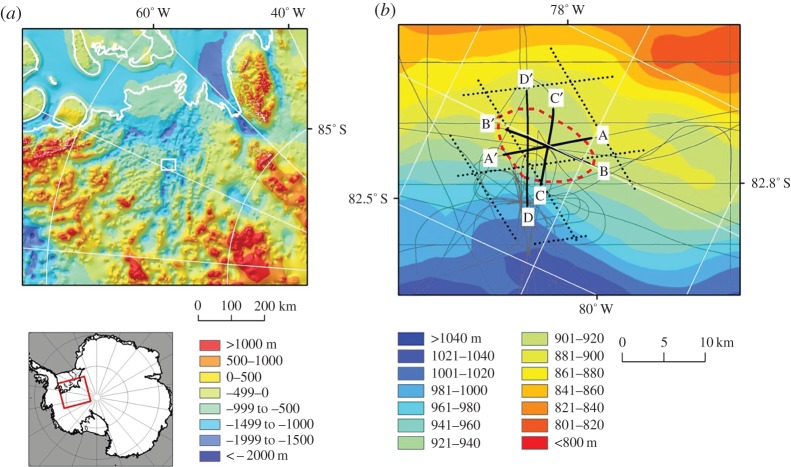
Figure 1.
Geophysical investigations of ‘active’ subglacial lake Institute E2. (a) Subglacial topography of the Institute Ice Stream region (with insert for the study region in West Antarctica) [34]. The grounding line is provided in white. Elevations are in metres above WGS84. (b) Ice-surface elevation with RES (grey lines) [35] and ICESat transects (black dotted lines) over and around Institute E2 (dashed line), as delineated by Smith et al. [27]. RES lines in black and labelled A–A’, B–B’ and C–C’ refer to RES transects provided in figure 2. Elevations are in metres above WGS84. (Adapted from Siegert et al. [33].)

