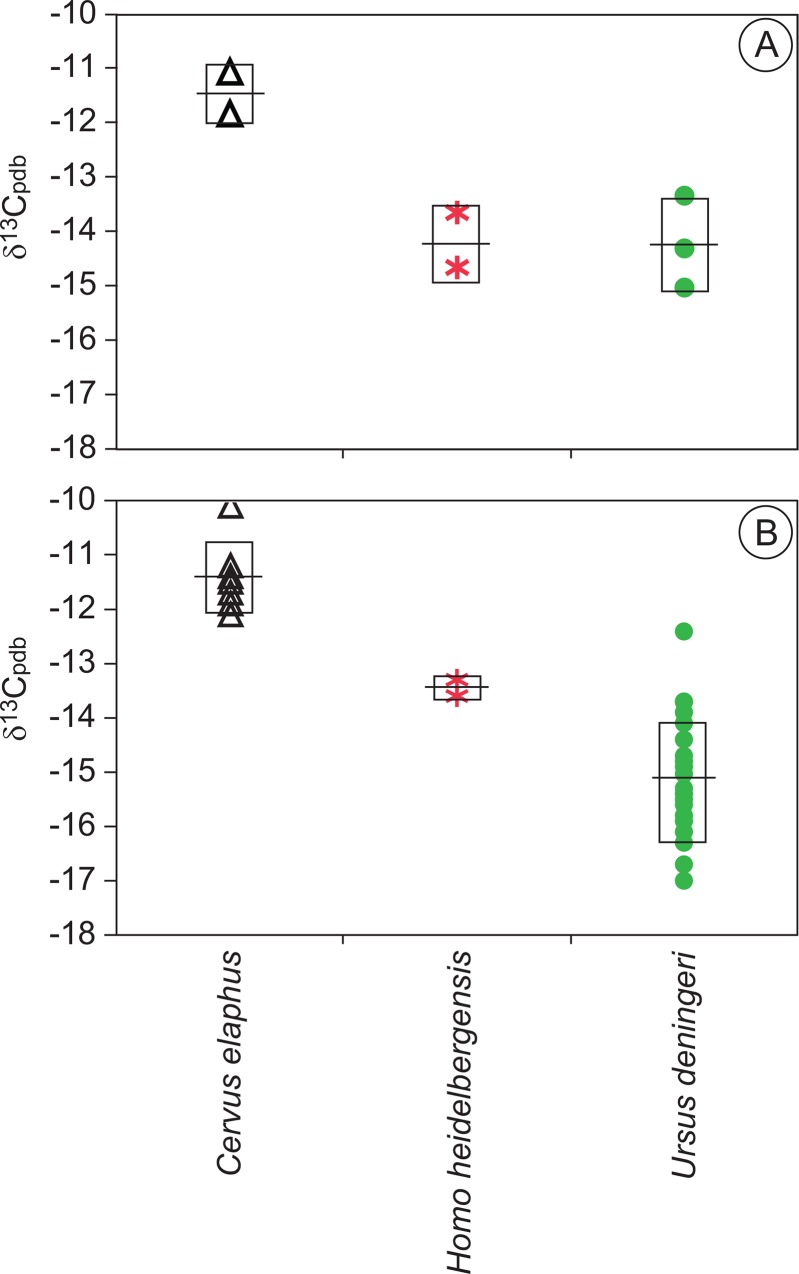
Fig 3. Comparison of average laser ablation carbon isotope values (A) to values obtained by the bulk sampling technique (B) for specimens analyzed by laser ablation in this study.
Non-hominin bulk sampling data from [31] (Garcia Garcia et al., 2009). Line represents mean value, while boxes represent one standard deviation from mean. Results show a similar pattern between the laser ablation and bulk sampling data.

