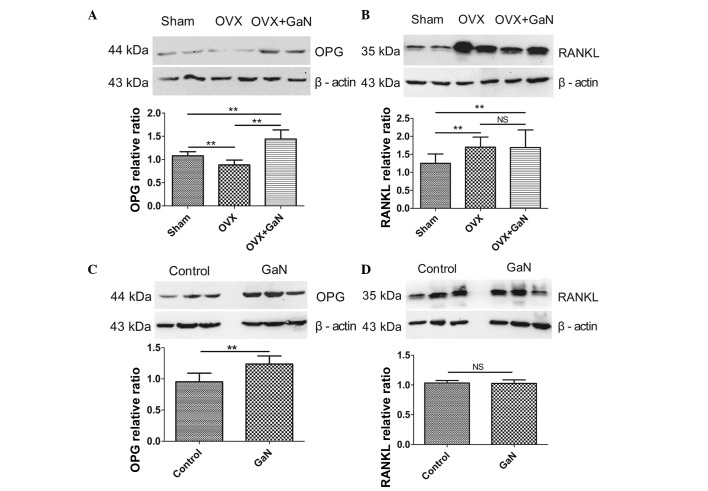
Figure 7.
Protein expression levels of OPG and RANKL in bone tissue were measured by western blotting. Data were normalized against β-actin. (A) The OPG protein relative ratio in vivo. (B) The RANKL protein relative ratio in vivo. (C) The OPG protein relative ratio in vitro. (D) The RANKL protein relative ratio in vitro. Values are presented as the mean ± standard deviation. *P<0.05, **P<0.01. OPG, osteoprotegerin; RANKL, receptor activator of nuclear factor-κB ligand; OVX, ovariectomized rats; GaN, gallium nitrate; NS, not significant.

